Keras 2 : ガイド : ハイパーパラメータ調整 – ハイパーパラメータ調整過程の可視化 (翻訳/解説)
翻訳 : (株)クラスキャット セールスインフォメーション
作成日時 : 10/31/2021 (keras 2.6.0)
* 本ページは、Keras の以下のドキュメントを翻訳した上で適宜、補足説明したものです:
- Visualize the hyperparameter tuning process (Author: Haifeng Jin)
* サンプルコードの動作確認はしておりますが、必要な場合には適宜、追加改変しています。
* ご自由にリンクを張って頂いてかまいませんが、sales-info@classcat.com までご一報いただけると嬉しいです。

- 人工知能研究開発支援
- 人工知能研修サービス(経営者層向けオンサイト研修)
- テクニカルコンサルティングサービス
- 実証実験(プロトタイプ構築)
- アプリケーションへの実装
- 人工知能研修サービス
- PoC(概念実証)を失敗させないための支援
- テレワーク & オンライン授業を支援
- お住まいの地域に関係なく Web ブラウザからご参加頂けます。事前登録 が必要ですのでご注意ください。
- ウェビナー運用には弊社製品「ClassCat® Webinar」を利用しています。
◆ お問合せ : 本件に関するお問い合わせ先は下記までお願いいたします。
| 株式会社クラスキャット セールス・マーケティング本部 セールス・インフォメーション |
| E-Mail:sales-info@classcat.com ; WebSite: https://www.classcat.com/ ; Facebook |
Keras 2 : ガイド : ハイパーパラメータ調整 – ハイパーパラメータ調整過程の可視化
イントロダクション
KerasTuner はユーザが進捗を監視するためにログをスクリーンにプリントします、これは各トライアルのハイパーパラメータの値を含みます。けれども、ログを読むことは結果に与えるハイパーパラメータの影響を知覚するために十分に直感的ではありません。そのため、ハイパーパラメータ値と対応する評価結果を TensorBoard を使用して対話的な図で可視化する方法を提供します。
TensorBoard は機械学習実験の可視化のために有用なツールです。それはモデル訓練の間に損失とメトリクスを監視してモデル・アーキテクチャを可視化することができます。TensorBoard で KerasTuner を実行すると HParams プラグインを使用してハイパーパラメータの調整結果を可視化する追加機能を与えます。
MNIST 画像分類データセットのモデルを調整する単純なサンプルを使用して、KerasTuner を TensorBoard と共に使用する方法を示します。
最初のステップはデータをダウンロードしてフォーマットします。
import numpy as np
import keras_tuner as kt
from tensorflow import keras
from tensorflow.keras import layers

(x_train, y_train), (x_test, y_test) = keras.datasets.mnist.load_data()
# Normalize the pixel values to the range of [0, 1].
x_train = x_train.astype("float32") / 255
x_test = x_test.astype("float32") / 255
# Add the channel dimension to the images.
x_train = np.expand_dims(x_train, -1)
x_test = np.expand_dims(x_test, -1)
# Print the shapes of the data.
print(x_train.shape)
print(y_train.shape)
print(x_test.shape)
print(y_test.shape)
Downloading data from https://storage.googleapis.com/tensorflow/tf-keras-datasets/mnist.npz
11493376/11490434 [==============================] - 0s 0us/step
(60000, 28, 28, 1)
(60000,)
(10000, 28, 28, 1)
(10000,)
そして、ハイパーパラメータを使用するモデルを構築するために build_model 関数を書いてモデルを返します。ハイパーパラメータは使用するモデルのタイプ (多層パーセプトロン or 畳込みニューラルネットワーク)、層の数、ユニットやフィルタの数、dropout を使用するか否かを含みます。
def build_model(hp):
    inputs = keras.Input(shape=(28, 28, 1))
    # Model type can be MLP or CNN.
    model_type = hp.Choice("model_type", ["mlp", "cnn"])
    x = inputs
    if model_type == "mlp":
        x = layers.Flatten()(x)
        # Number of layers of the MLP is a hyperparameter.
        for i in range(hp.Int("mlp_layers", 1, 3)):
            # Number of units of each layer are
            # different hyperparameters with different names.
            output_node = layers.Dense(
                units=hp.Int(f"units_{i}", 32, 128, step=32), activation="relu",
            )(x)
    else:
        # Number of layers of the CNN is also a hyperparameter.
        for i in range(hp.Int("cnn_layers", 1, 3)):
            x = layers.Conv2D(
                hp.Int(f"filters_{i}", 32, 128, step=32),
                kernel_size=(3, 3),
                activation="relu",
            )(x)
            x = layers.MaxPooling2D(pool_size=(2, 2))(x)
        x = layers.Flatten()(x)

    # A hyperparamter for whether to use dropout layer.
    if hp.Boolean("dropout"):
        x = layers.Dropout(0.5)(x)

    # The last layer contains 10 units,
    # which is the same as the number of classes.
    outputs = layers.Dense(units=10, activation="softmax")(x)
    model = keras.Model(inputs=inputs, outputs=outputs)

    # Compile the model.
    model.compile(
        loss="sparse_categorical_crossentropy", metrics=["accuracy"], optimizer="adam",
    )
    return model
それが CNN と MLP の両方を成功的に構築するか確認するためにモデルの素早いテストを行なうことができます。
# Initialize the `HyperParameters` and set the values.
hp = kt.HyperParameters()
hp.values["model_type"] = "cnn"
# Build the model using the `HyperParameters`.
model = build_model(hp)
# Test if the model runs with our data.
model(x_train[:100])
# Print a summary of the model.
model.summary()

# Do the same for MLP model.
hp.values["model_type"] = "mlp"
model = build_model(hp)
model(x_train[:100])
model.summary()
Model: "model"
_________________________________________________________________
Layer (type)                 Output Shape              Param #
=================================================================
input_1 (InputLayer)         [(None, 28, 28, 1)]       0
_________________________________________________________________
conv2d (Conv2D)              (None, 26, 26, 32)        320
_________________________________________________________________
max_pooling2d (MaxPooling2D) (None, 13, 13, 32)        0
_________________________________________________________________
flatten (Flatten)            (None, 5408)              0
_________________________________________________________________
dense (Dense)                (None, 10)                54090
=================================================================
Total params: 54,410
Trainable params: 54,410
Non-trainable params: 0
_________________________________________________________________

Model: "model_1"
_________________________________________________________________
Layer (type)                 Output Shape              Param #
=================================================================
input_2 (InputLayer)         [(None, 28, 28, 1)]       0
_________________________________________________________________
flatten_1 (Flatten)          (None, 784)               0
_________________________________________________________________
dense_2 (Dense)              (None, 10)                7850
=================================================================
Total params: 7,850
Trainable params: 7,850
Non-trainable params: 0
_________________________________________________________________
RandomSearch チューナーを 10 トライアルで初期化してモデルを選択するためのメトリックとして検証精度を使用します。
tuner = kt.RandomSearch(
    build_model,
    max_trials=10,
    # Do not resume the previous search in the same directory.
    overwrite=True,
    objective="val_accuracy",
    # Set a directory to store the intermediate results.
    directory="/tmp/tb",
)
tuner.search(…) を呼び出して探索を始めます。TensorBoard を使用するには、callbacks に keras.callbacks.TensorBoard インスタンスを渡す必要があります。
tuner.search(
    x_train,
    y_train,
    validation_split=0.2,
    epochs=2,
    # Use the TensorBoard callback.
    # The logs will be write to "/tmp/tb_logs".
    callbacks=[keras.callbacks.TensorBoard("/tmp/tb_logs")],
)
Trial 10 Complete [00h 00m 04s]
val_accuracy: 0.9230833053588867

Best val_accuracy So Far: 0.9890000224113464
Total elapsed time: 00h 07m 43s
INFO:tensorflow:Oracle triggered exit
Colab で実行している場合、以下の 2 つのコマンドで Colab 内に TensorBoard を表示します。
%load_ext tensorboard

%tensorboard --logdir /tmp/tb_logs
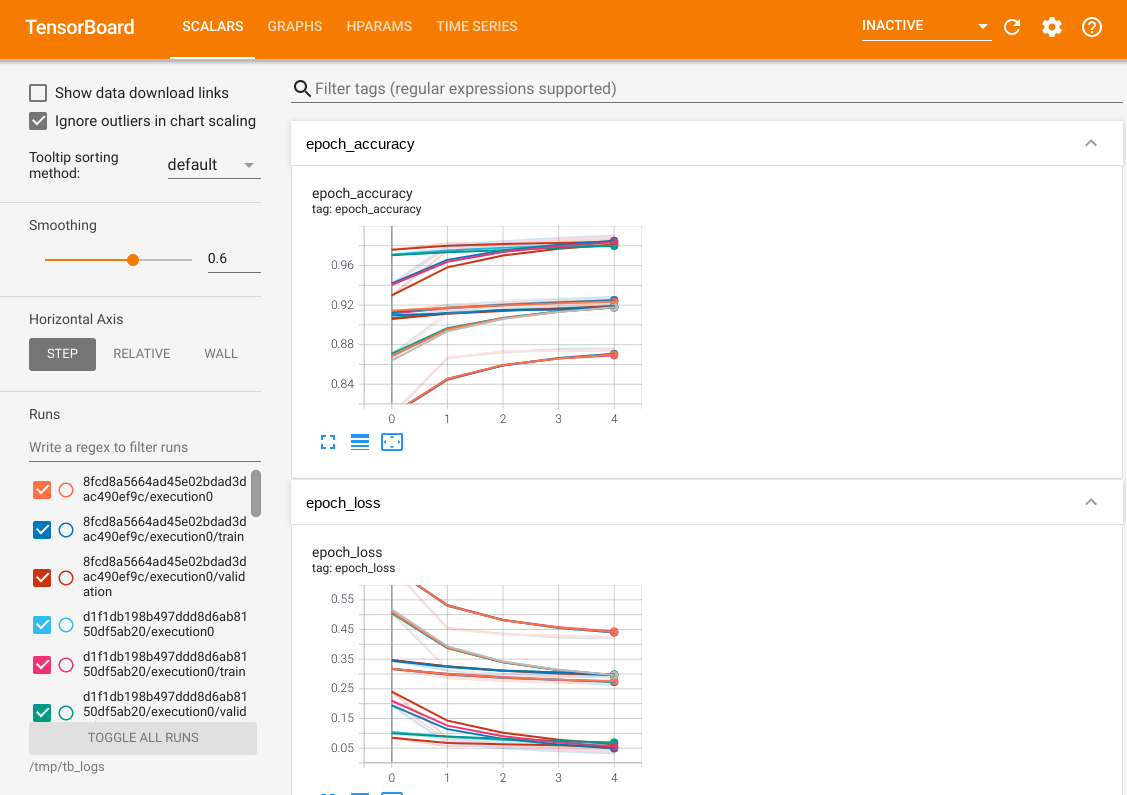
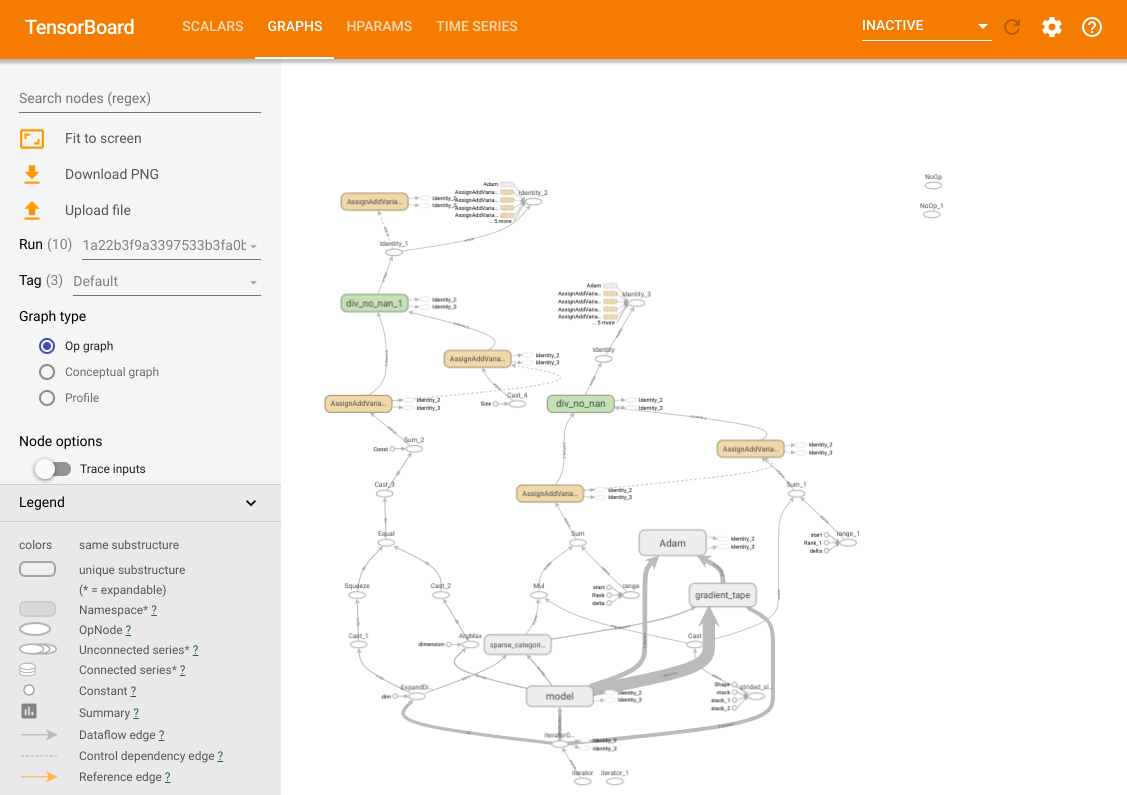
TensorBoard の総ての共通機能にアクセスできます。例えば、損失とメトリクス曲線を表示したり、異なるトライアルのモデルの計算グラフを可視化できます。
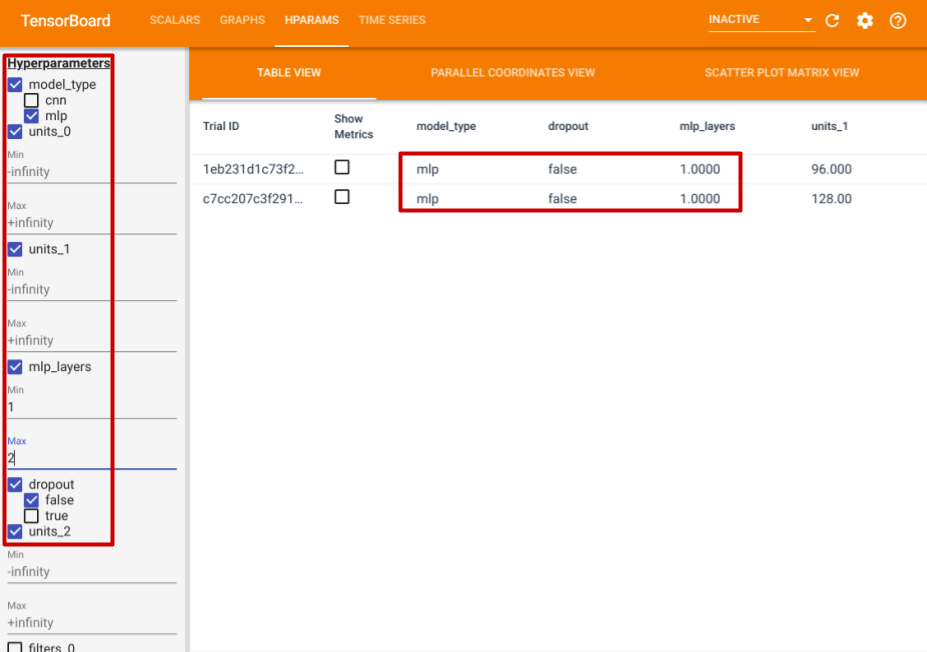
これらの機能に加えて、HParams タブも持ちます、そこでは 3 つのビューがあります。テーブル・ビューでは、異なるハイパーパラメータ値と評価メトリクスを持つ 10 つの異なるトライアルを見ることができます。
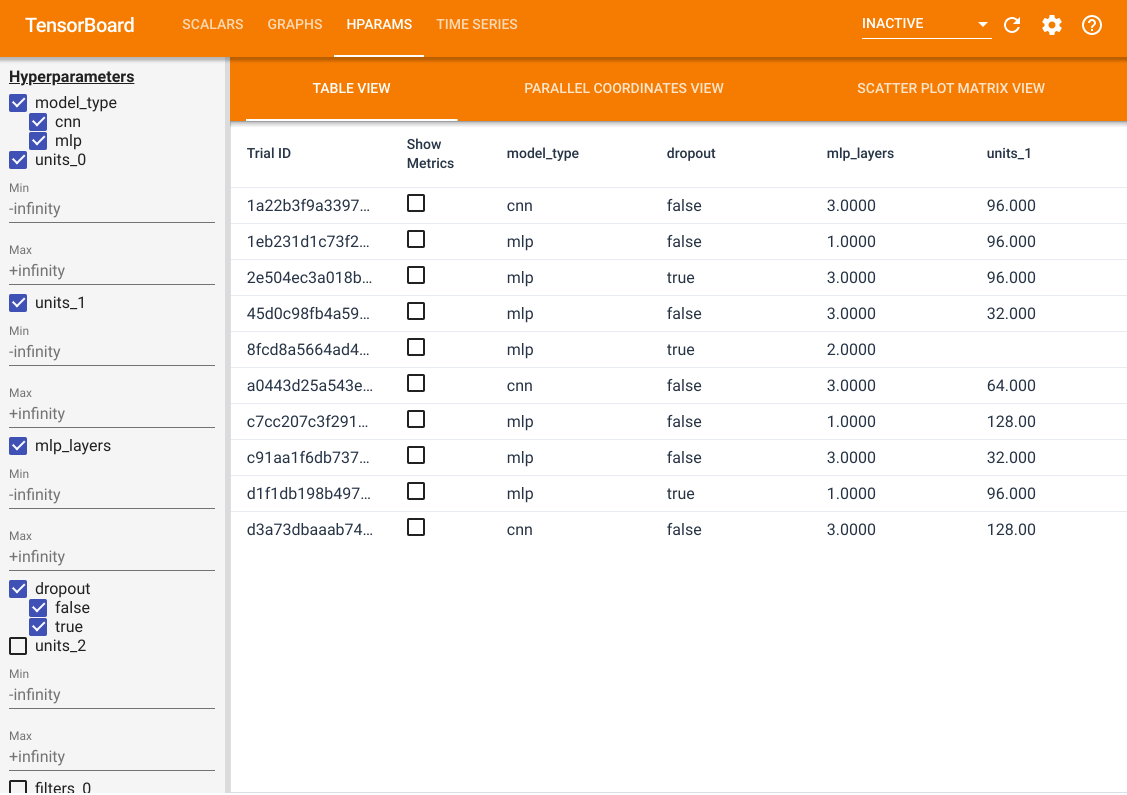
左側では、特定のハイパーパラメータのためのフィルタを指定できます。例えば、dropout 層を持たず 1 から 2 つの dense 層を持つ MLP モデルだけを表示するように指定できます。
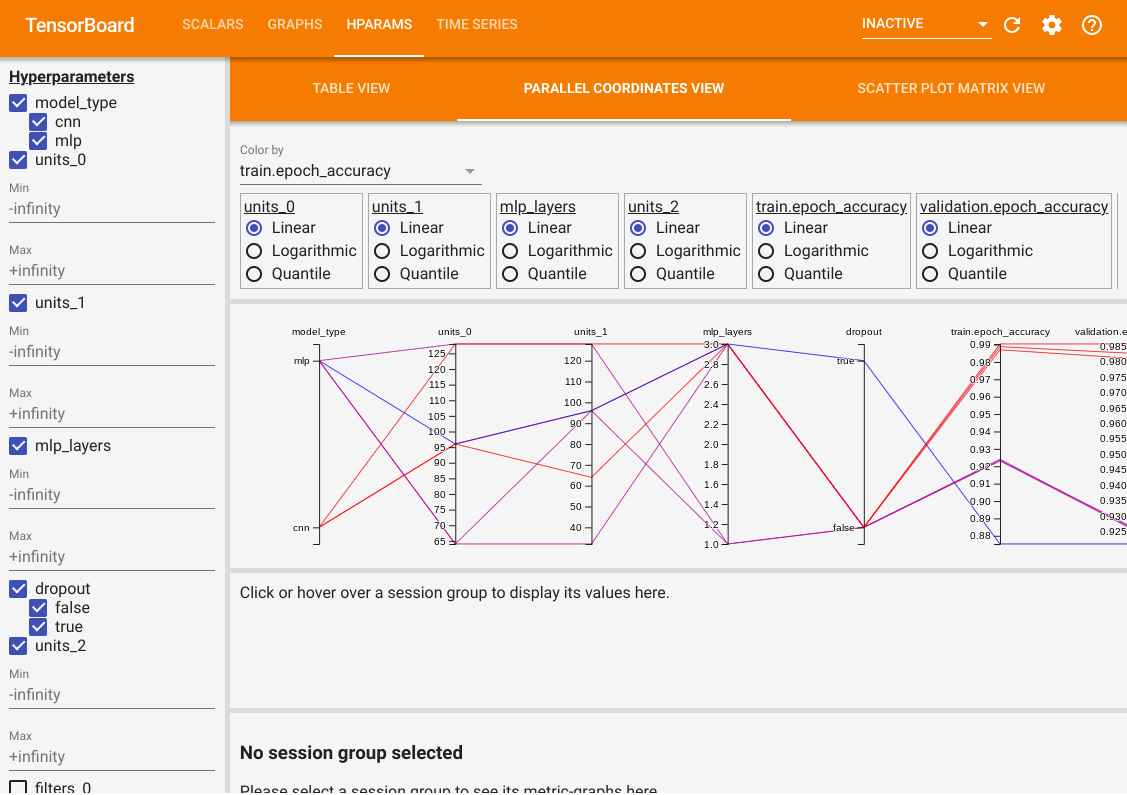
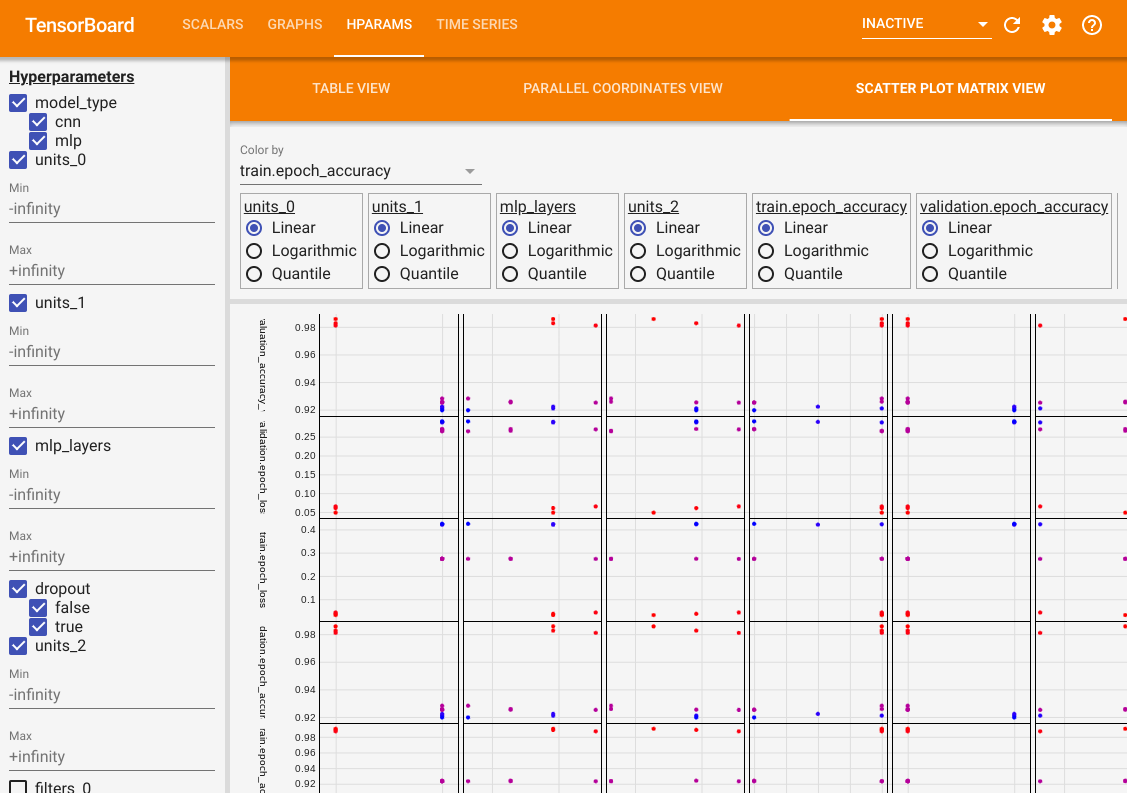
テーブルビューの他に、2 つの他のビューも提供します、並列座標ビューと散布図行列ビューです。これらは単に同じデータのための異なる可視化方法です。結果をフィルタリングするためにやはり左側のパネルを使用できます。
並列座標ビューでは、各色のラインはトライアルです。軸はハイパーパラメータと評価メトリクスです。
散布図行列ビューでは、各ドットがトライアルです。プロットは軸として異なるハイパーパラメータとメトリクスを持つ、平面上へのトライアルの射影です。
以上